VDP v12.1 Security Features Deep Dive Series (Part 3) - Comprehensive Threat Monitoring
In VDP v12.1, not only have security scanning capabilities been added during and after backup processes, but significant enhancements have also been made to monitoring and compliance management. To better help administrators improve backup system security, VBR has introduced a fully automated security compliance checking capability called Security & Compliance Analyzer. Additionally, in the Enterprise Edition, a completely new Threat Center dashboard has been launched.
Security & Compliance Analyzer
This component actually existed in v12, where it was called Best Practices Analyzer, but the first version’s functionality wasn’t quite comprehensive and its detection capabilities were somewhat limited. In the new version, Best Practices Analyzer has been renamed to Security & Compliance Analyzer, and its capabilities have been significantly enhanced.
In v12.1, Security & Compliance Analyzer includes 31 security checks that examine security best practices for both the operating system where VBR is installed and the backup infrastructure.
How to Use
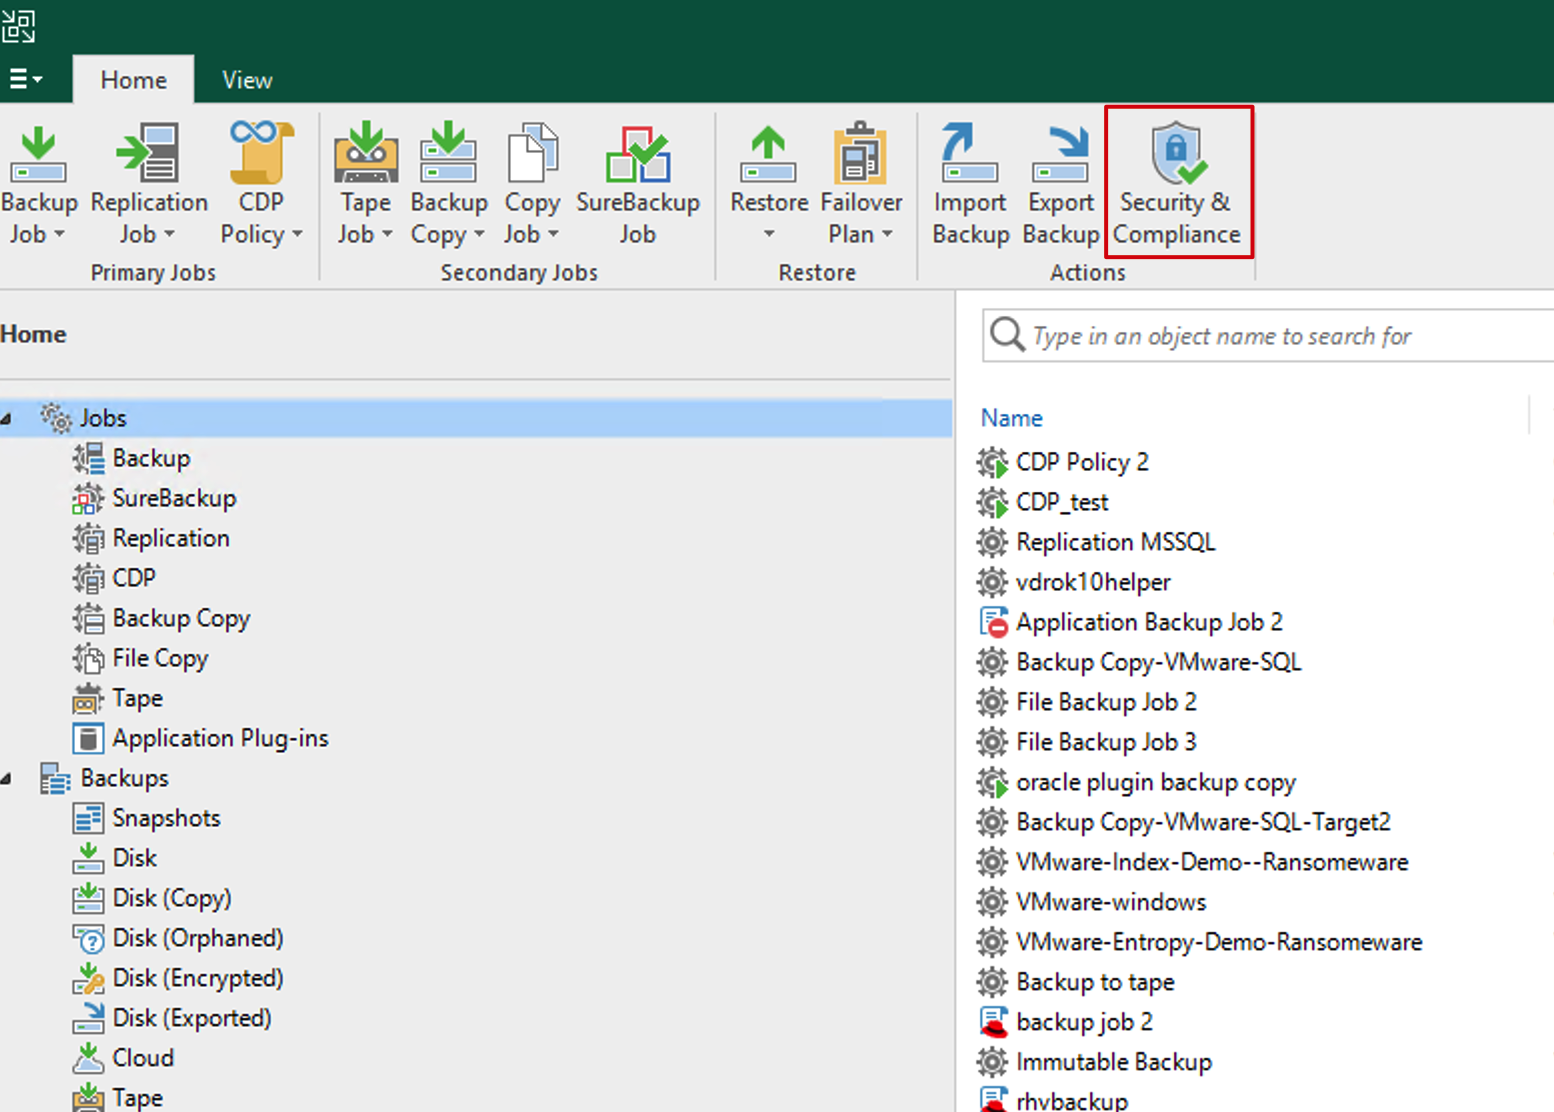
Security & Compliance Analyzer is very straightforward to use. In the VBR console’s Home interface, simply click the toolbar button at the top to access it.
Once you enter, Security & Compliance Analyzer automatically starts scanning the current environment. The scan completes within a few minutes, and the results for each check are displayed in the status bar on the right. Green ✅ indicates the check passed and complies with security best practices; red ❌ means the best practice check failed and the current environment needs optimization; additionally, there’s a yellow ⚠️ status indicating that the current environment cannot be detected.

For details on these 31 detection items, you can refer to the official documentation.
In addition to manual checks through the interface, Security & Compliance Analyzer also supports scheduled scans to automatically check the current environment. The system can automatically run all checks at a specific time each day and send notifications to specified administrator emails upon completion.

This approach ensures that all security measures in the environment are continuously managed and monitored, preventing arbitrary modifications and system configuration disruptions.
Post-Scan Remediation
Some security issues identified in these scans can be addressed through operating system security hardening techniques. To make it more convenient for administrators, Veeam has collected these hardening procedures and created one-click hardening scripts. Administrators can reference and modify these scripts according to their actual needs for system hardening. These scripts can be found at this knowledge base link: KB4525.
Of course, security and convenience are always relative. If administrators believe certain options must be retained, Veeam also provides a Suppress button to exclude specific checks from detection.
Threat Center Threat Detection Platform
In the VDP Enterprise Edition (this feature requires Enterprise Edition license activation and proper installation and configuration of Veeam ONE components), a completely new dashboard panel integrated with Veeam ONE has been added. Backup and security administrators can immediately view important security-related information about the current backup system without switching consoles to the Veeam ONE Dashboard.
In the VBR console, an Analytics section has been added to the navigation bar. Under this view, there are 4 built-in dashboards: Threat Center, Overview, Backup Heatmap, and Jobs Calendar. These dashboards all come from Veeam ONE Dashboard, and administrators can also access these dashboards directly through Veeam ONE Dashboard.
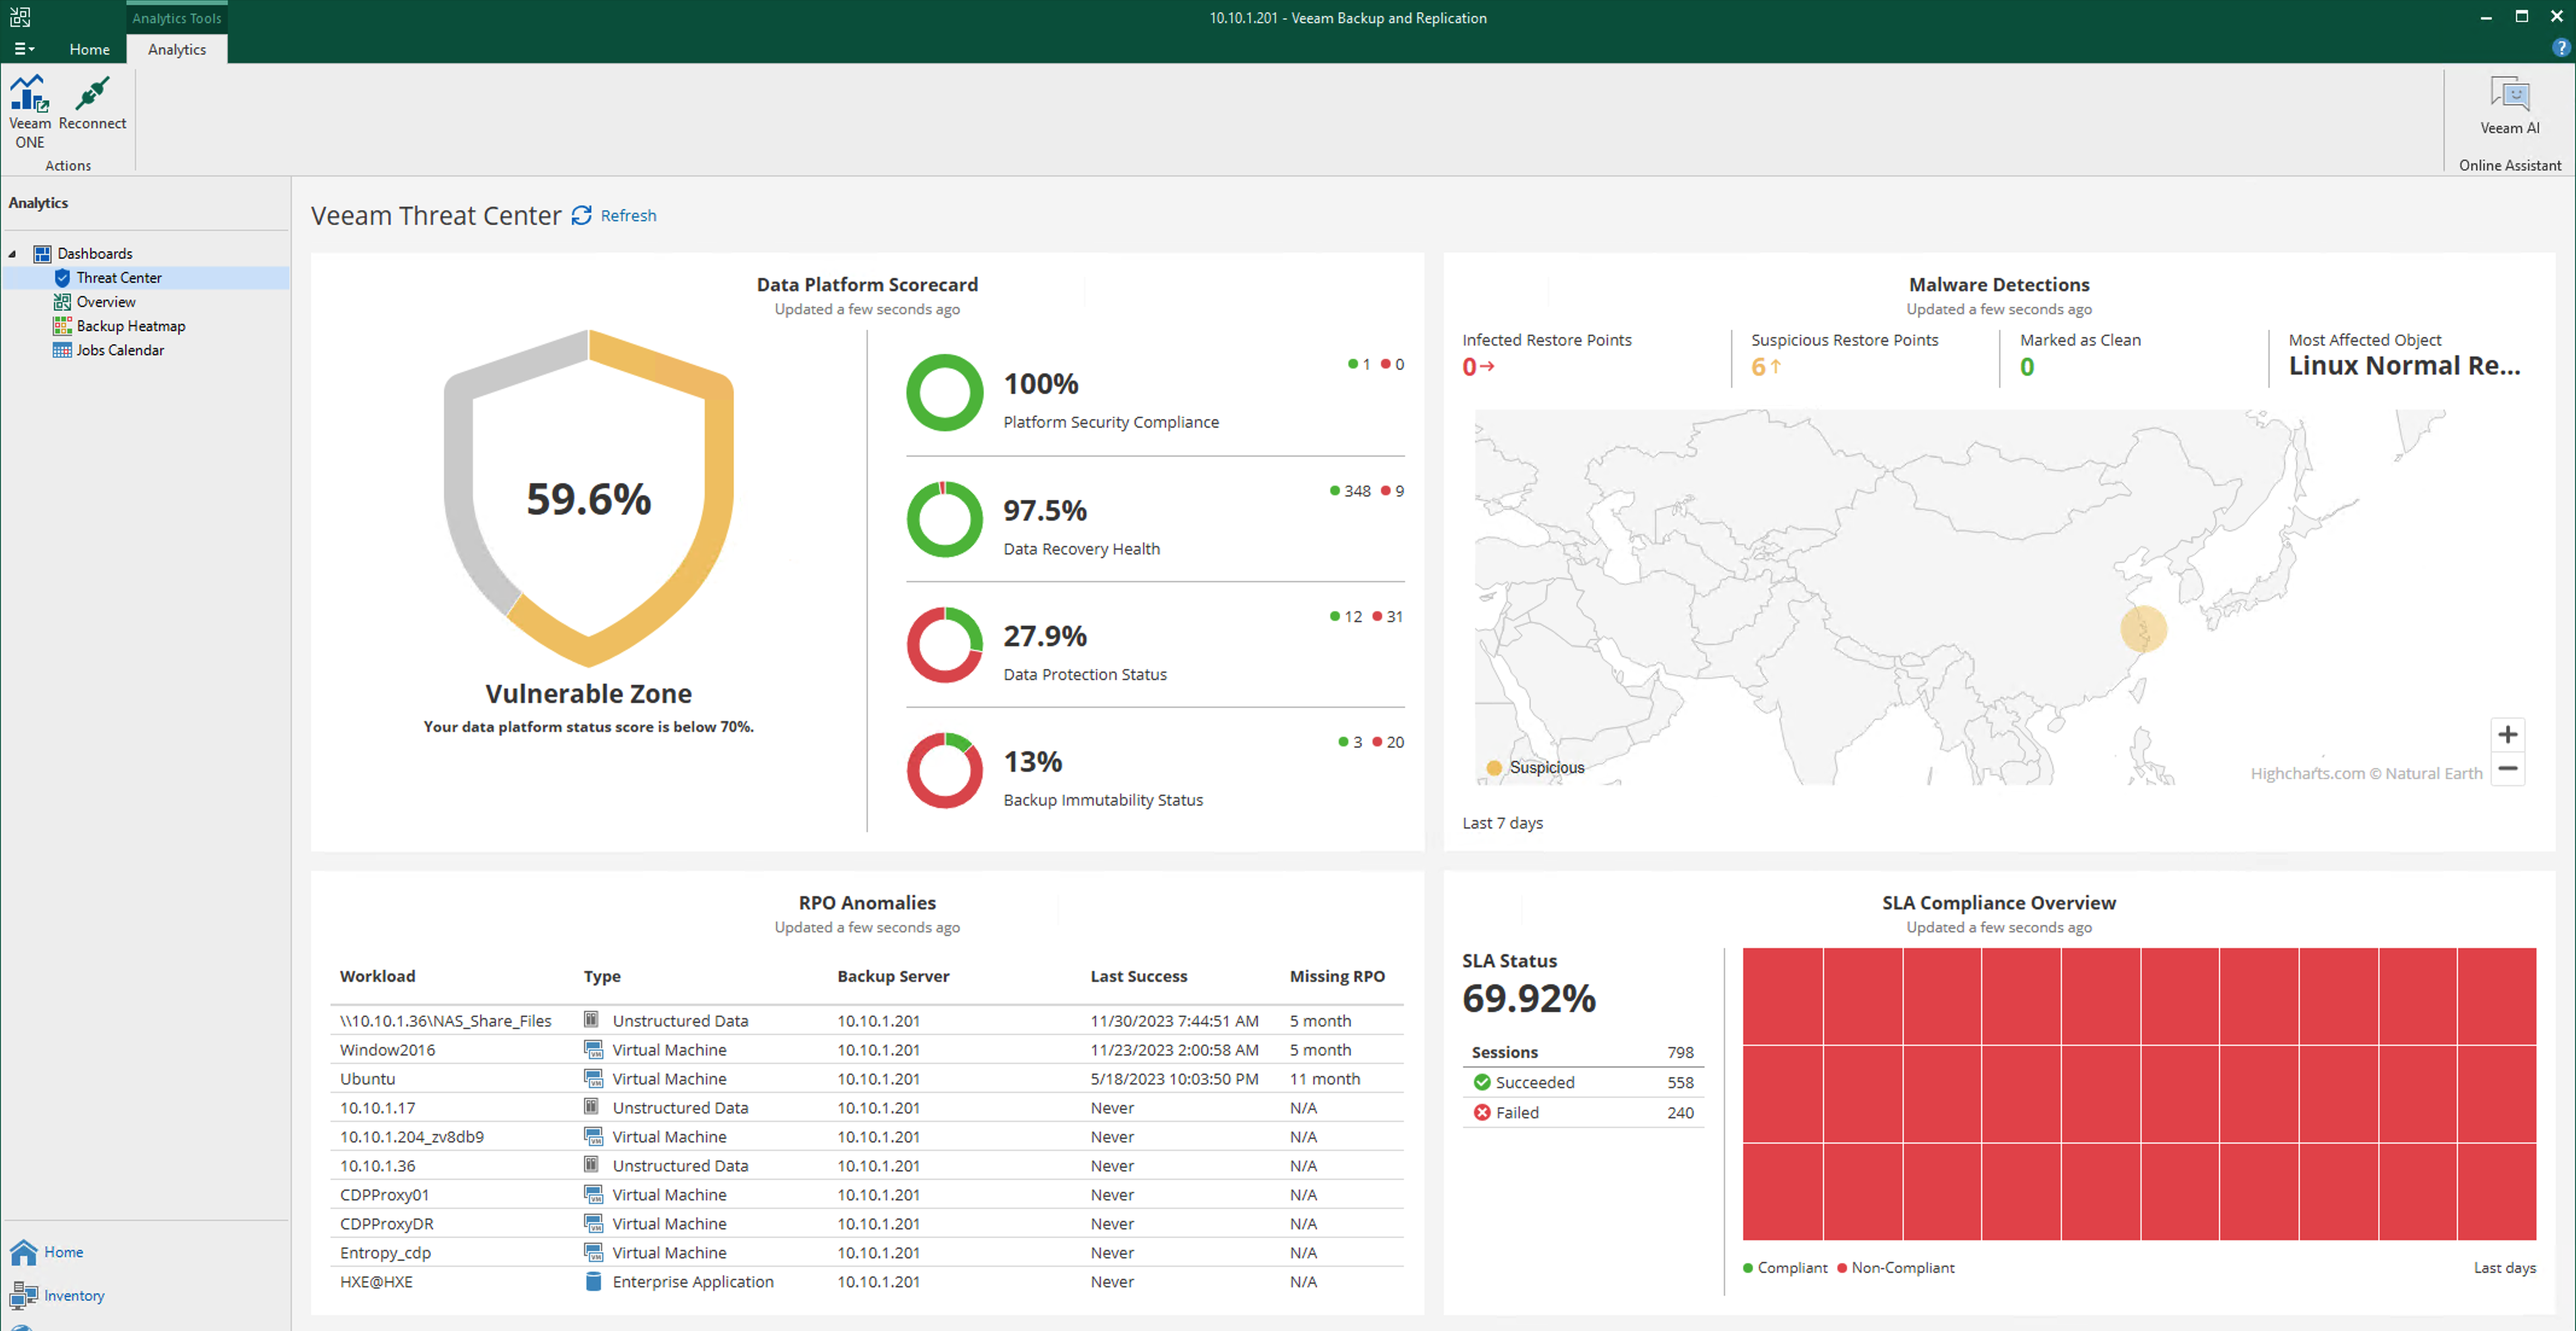
In the current first release, the Threat Center embedded in VBR has some minor issues - the content temporarily doesn’t support custom configuration. If you have specific requirements for display content, you can access the Threat Center page in Veeam ONE Dashboard, where you can freely customize the relevant content.
Threat Center Display Content
Threat Center consists of 4 parts. In the upper-left corner is a Data Platform scorecard. Veeam ONE calculates platform scores as percentages based on collected data across dimensions including platform security compliance, data recoverability health, data protection status, and backup immutability status. If scores are too low, yellow and red status indicators will be shown.
In the upper-right corner is a malicious attack detection map. Based on Repository locations, Threat Center displays the geographical locations of potential malicious attack activities on a world map.
In the lower-left corner is an RPO anomaly analysis table. This table identifies business systems that haven’t met their expected RPO targets among all workloads that need protection.
In the lower-right corner is SLA compliance status. If any backup jobs have failed, abnormal red blocks will appear in this red-green heatmap. Issues that occurred during the past period will be prominently displayed in this area.
Threat Center Configuration
In Veeam ONE Dashboard, you can configure the content displayed by Threat Center and the scope of data collection. The four parts mentioned above are 4 small components of the dashboard. In the upper-right corner of each of these 4 components, there’s a configuration button that opens the relevant configuration wizard.
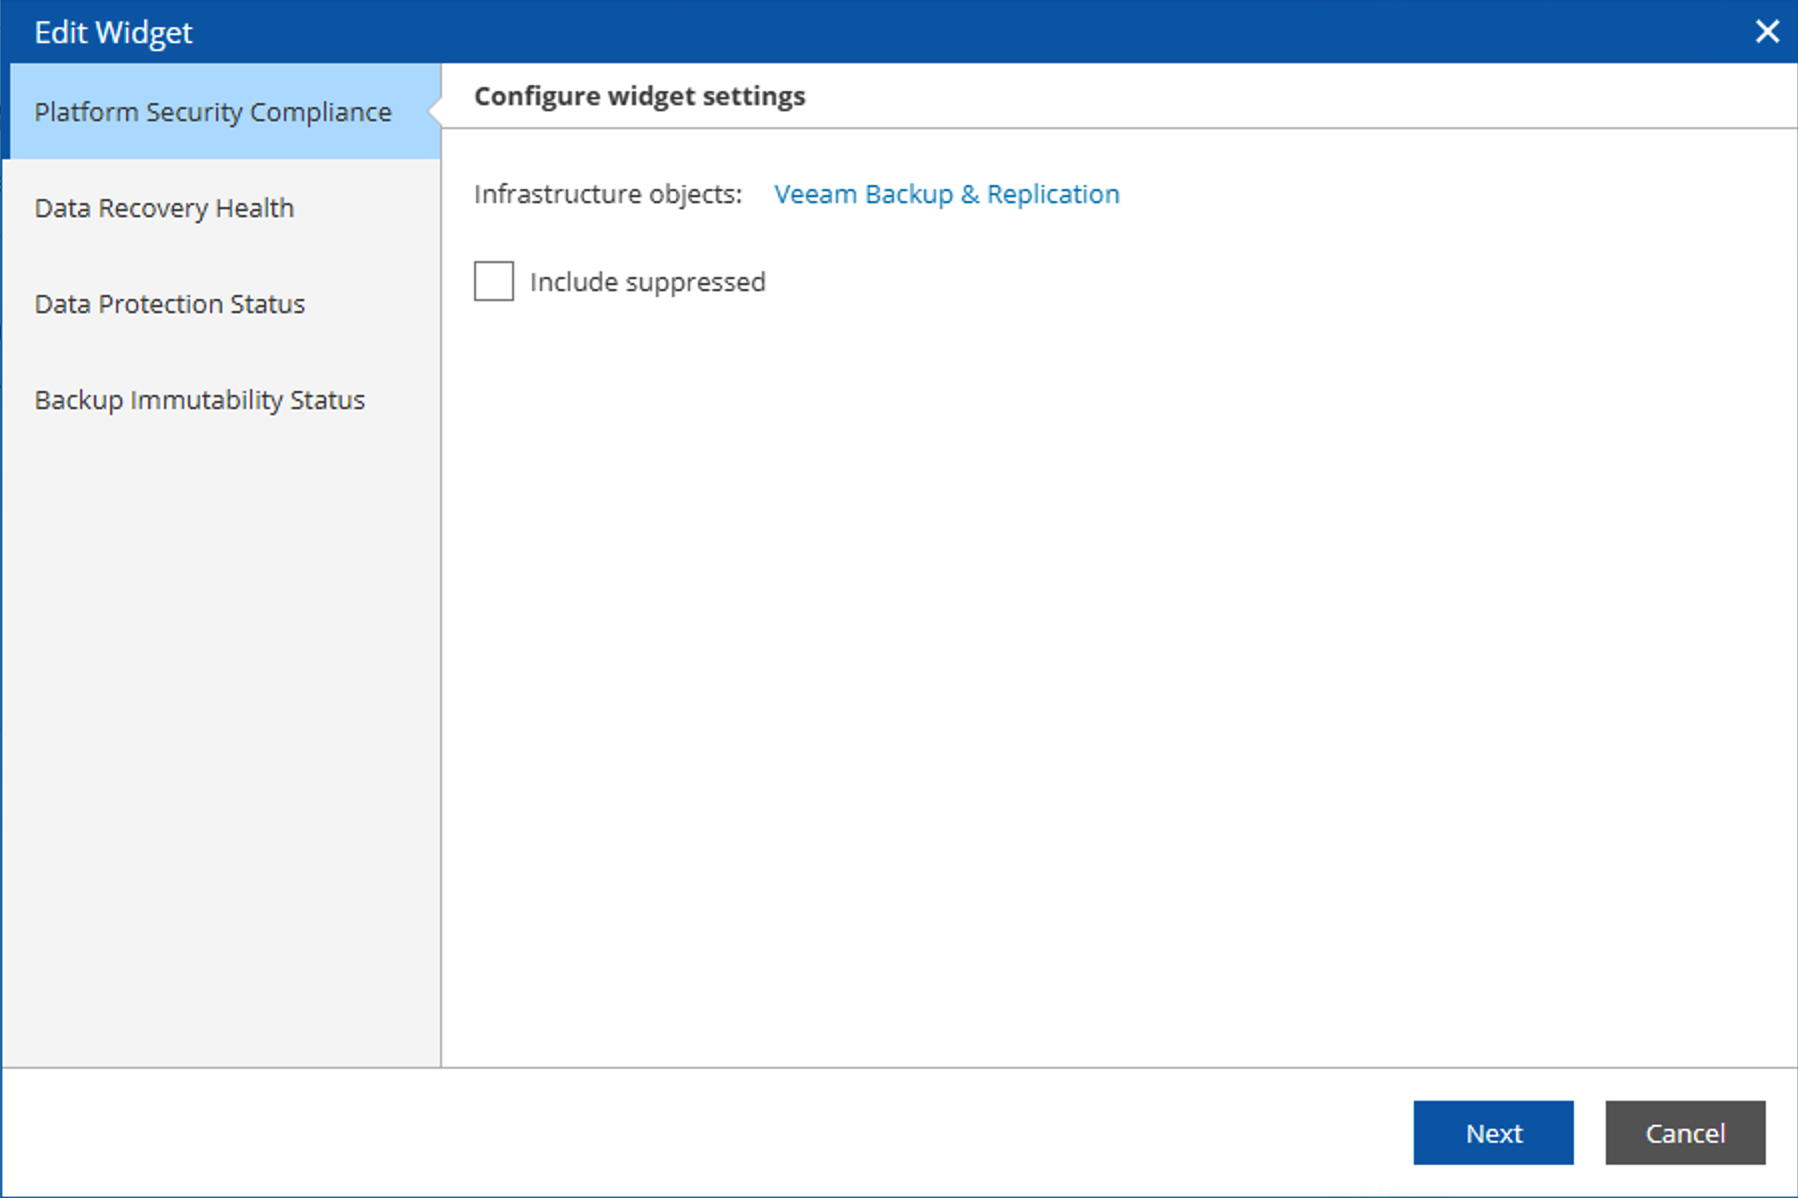
Data Platform Scorecard Configuration
The scorecard consists of 4 parts, so in this component’s wizard, there are corresponding configurations for each of the 4 different scores, including the objects and types of data collected. Administrators can adjust the scoring scope of the scorecard based on their areas of concern.
Malicious Attack Detection Map Configuration
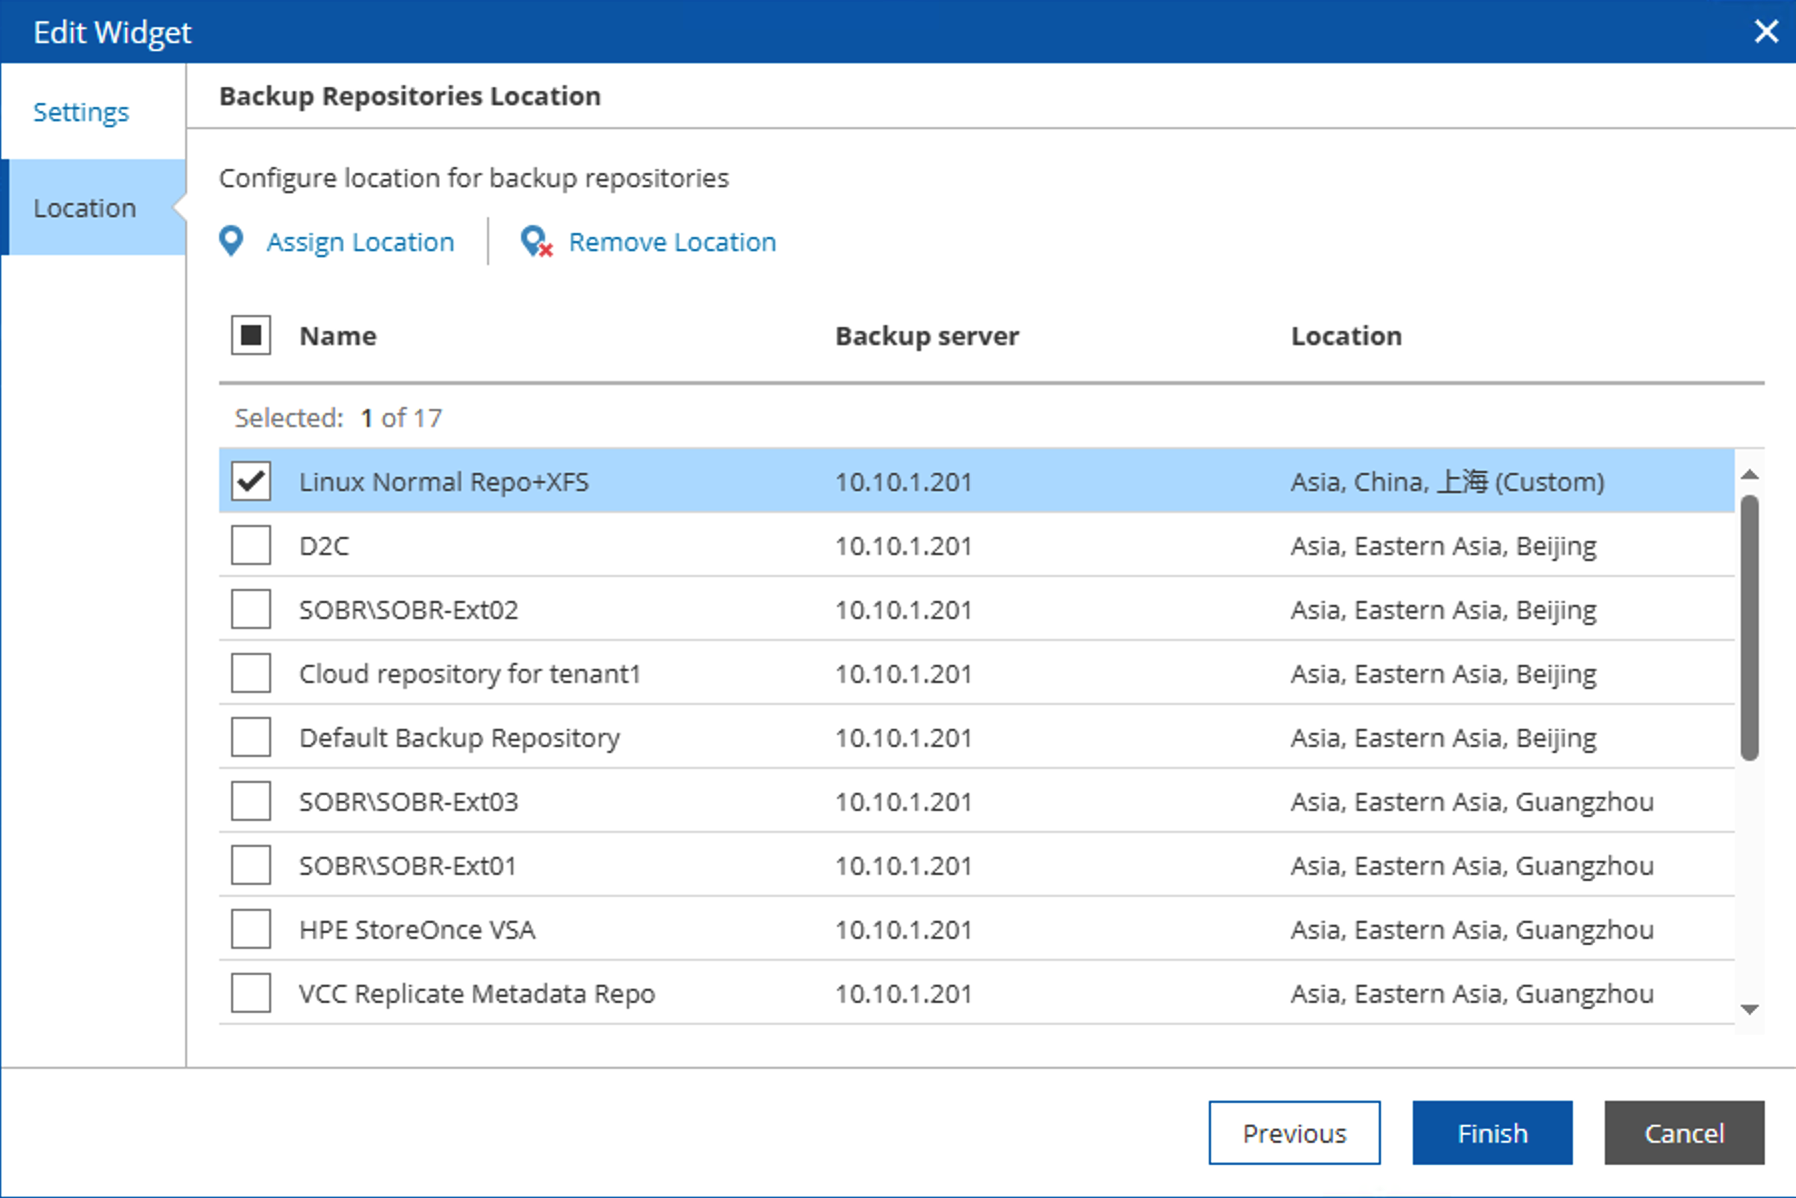
This component’s configuration includes two parts: one for detection time range and display method, and another for geographical location configuration. Here, geographical locations use an offline place name database built into Veeam ONE. Administrators can use the built-in English place names or set custom place names and geographical latitude/longitude coordinates through the Custom button. After setting the location for each Repository, this component can prominently display infected data centers on the map.
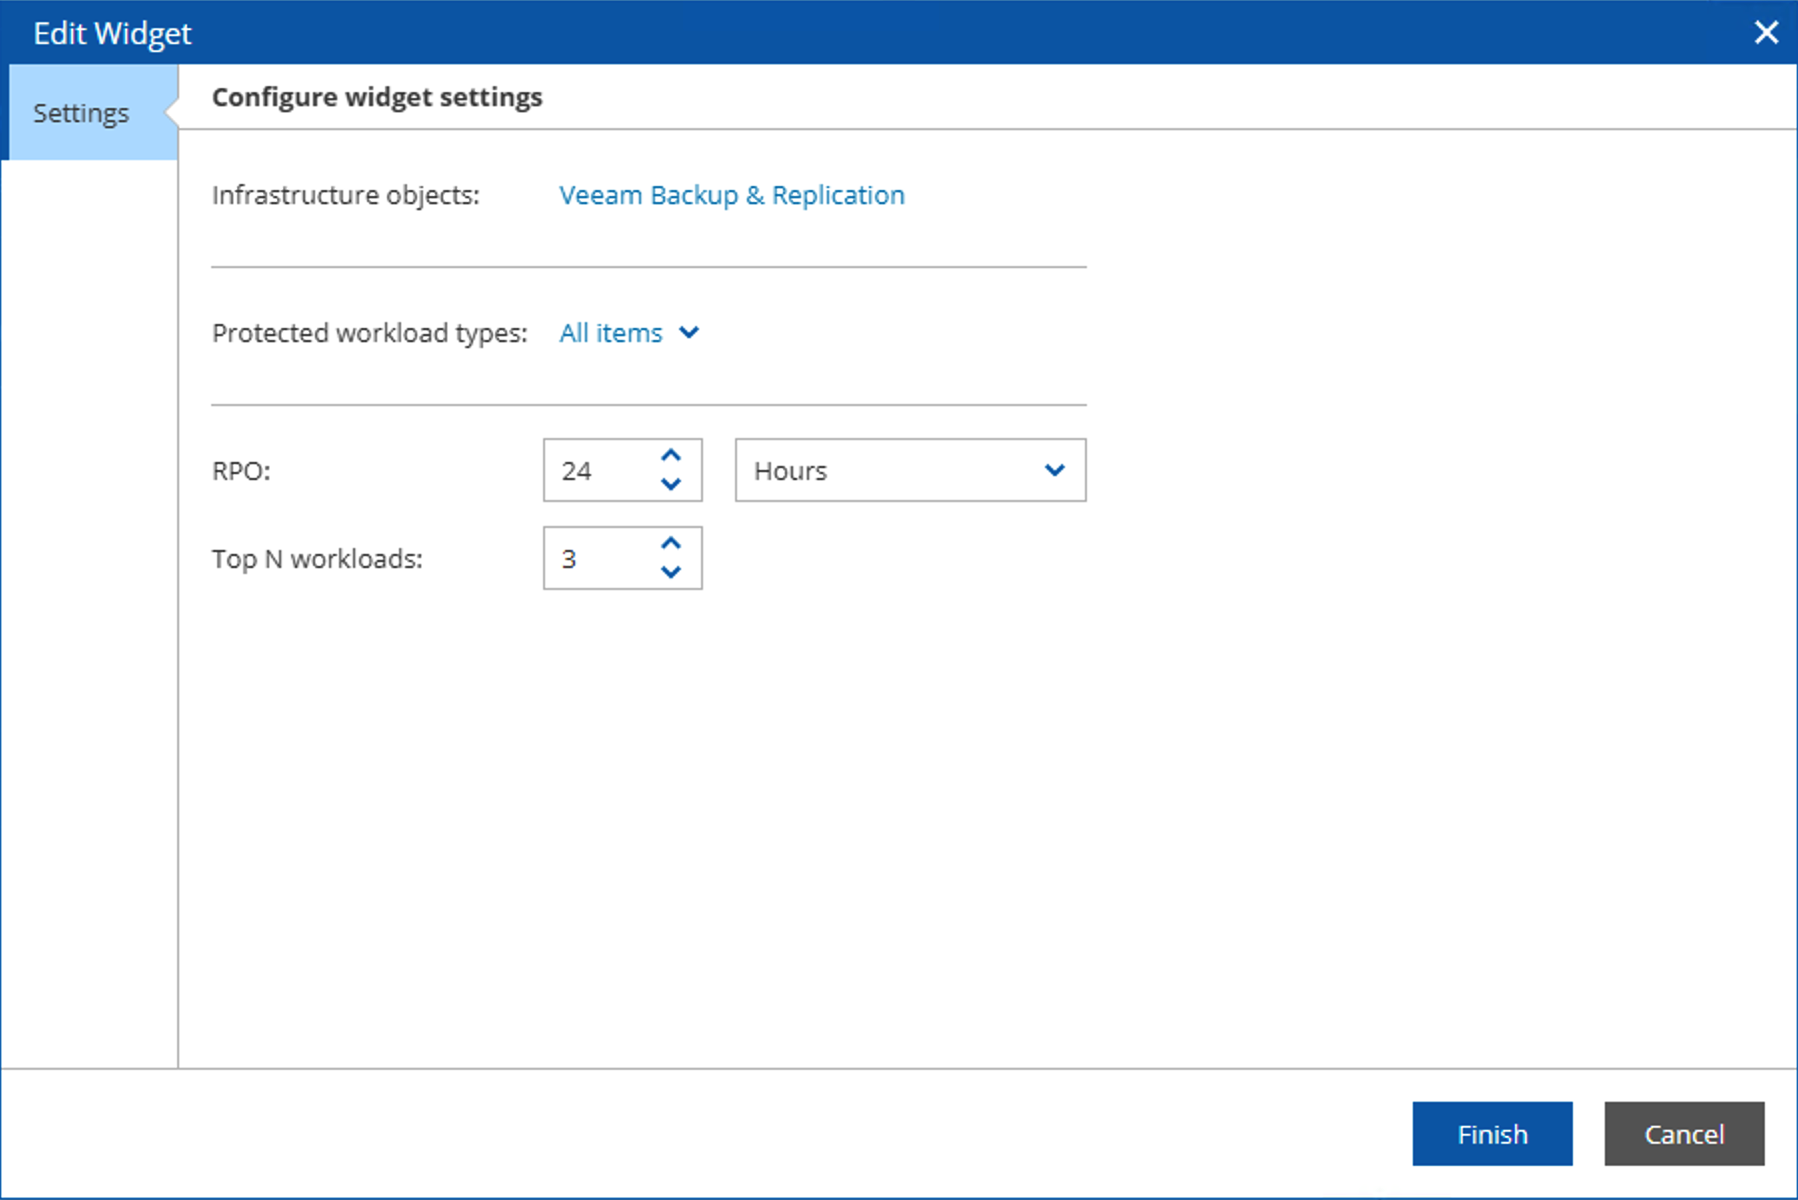
RPO Anomaly Analysis Configuration
This setting supports selection of infrastructure objects, RPO time range, and sorting by top N workloads. Administrators can customize the displayed content based on the data they’re actually concerned about.
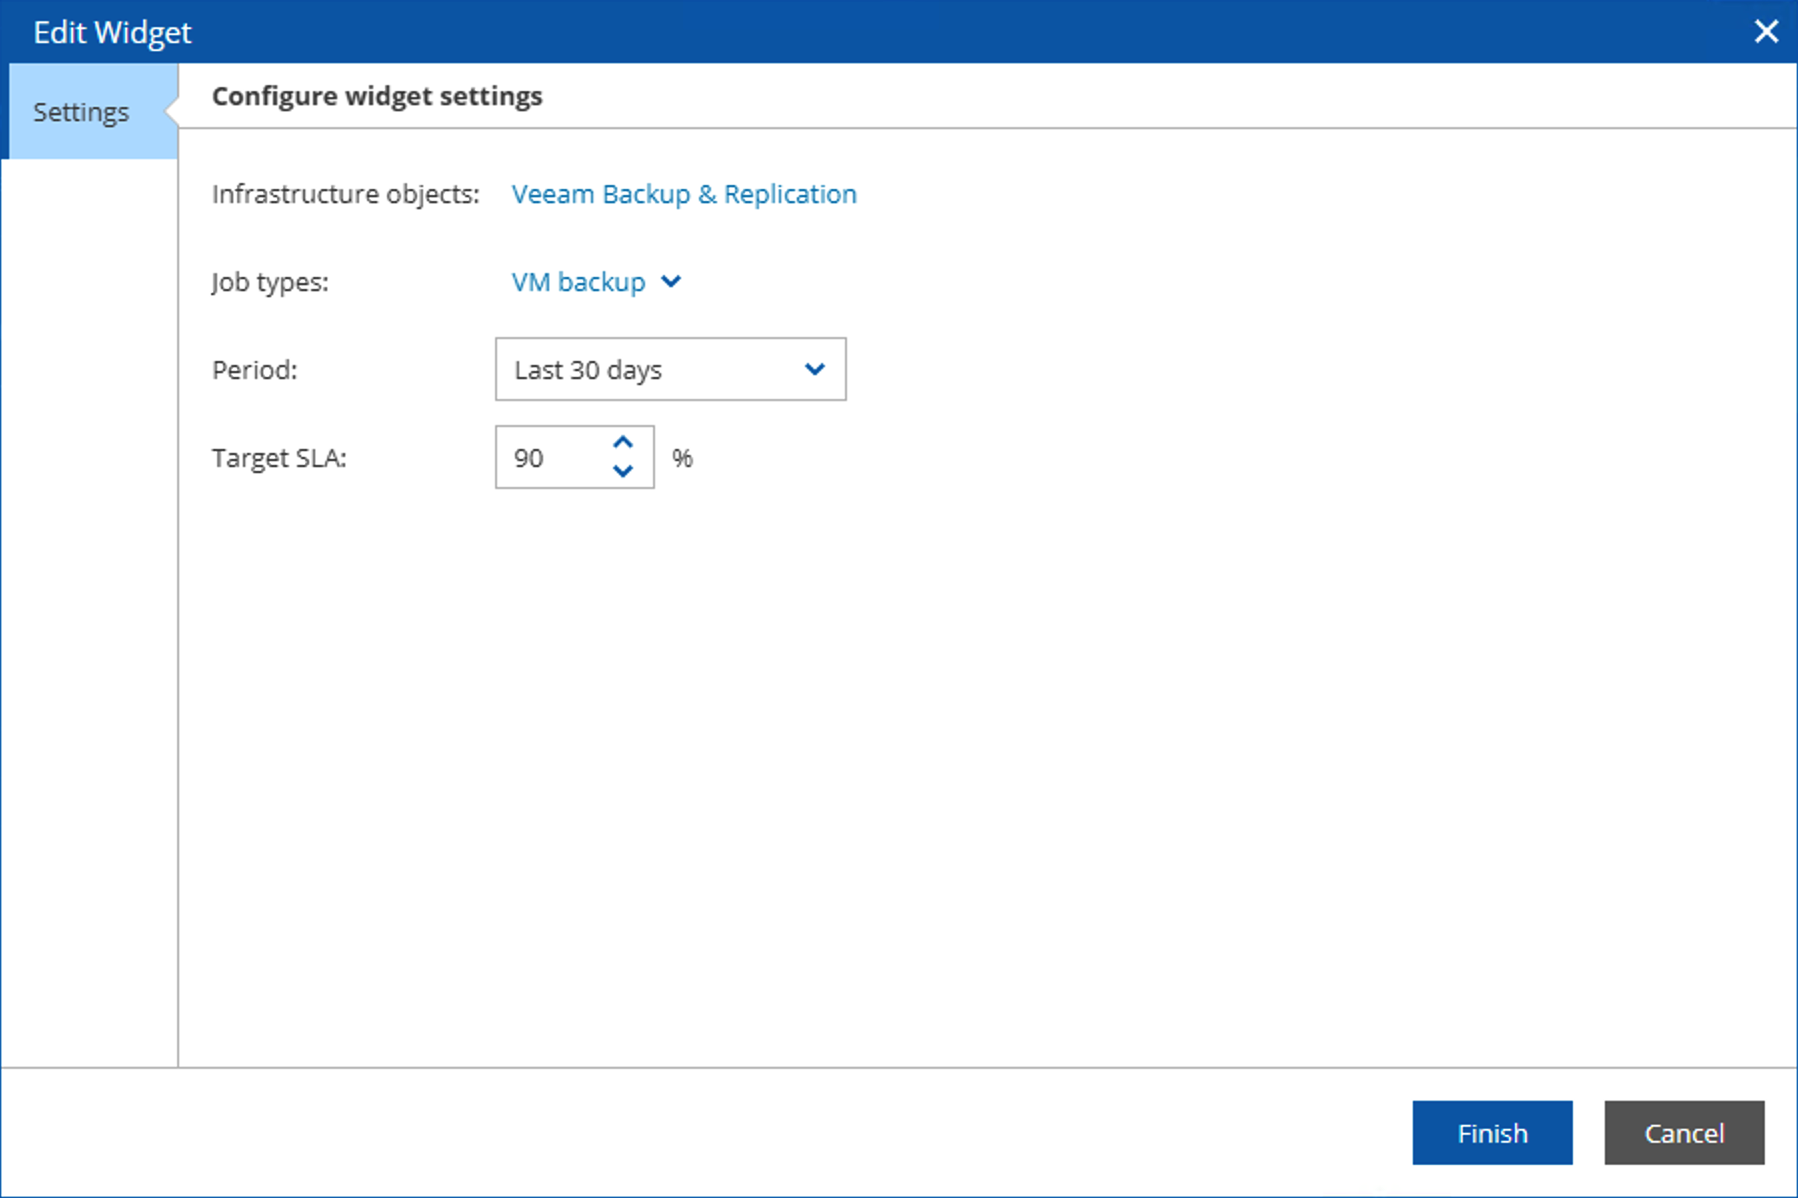
SLA Compliance Status Configuration
This setting supports selection of integrated architecture objects, job type selection, statistical time range, and target SLA values. Administrators can set the most relevant data based on their actual situation.
Since Veeam ONE is a multi-user system, all the above configurations only take effect for the currently logged-in user. Therefore, different users need to make corresponding settings based on their actual requirements.